Creating value through accountability
The Australian Leadership Index (ALI) is a national survey that provides a comprehensive picture of perceptions of leadership for the greater good in the government, public, private and not-for-profit sectors.
The ALI model of institutional leadership for the greater good delineates three sets of indicators of leadership for the greater good that pertain to the type of value that institutions seek to create, how institutions create value, and for whom institutions create value.
For each of these indicators, we measure public perceptions and expectations. In addition to this, we calculate the relationship between perceptions of each indicator and overall perceptions of leadership for the greater good, yielding insights into the key drivers of public perceptions of leadership in the government, public, private, and not-for-profit sectors.
This note is part of a three-part series on how institutions create value. The focus of this note, the first in the series, is on accountability, which is the extent to which institutional leaders accept responsibility for their actions and the consequences of their actions.
A note on the survey process
The results reported in this research note are the average of the results obtained from quarterly ALI surveys (1,000 people per quarter) between September 2018 and March 2020, which represents seven quarters of data collection.
Respondents are recruited via an online panel by Dynata and recruitment is designed to ensure that the sample is nationally representative in terms of locality (i.e., States and Territories), gender and age.
Results are analysed at the overall national level, as well as at the sector (i.e., government, public, private and not-for-profit sectors) and institution-level. ALI results can be further segmented according to a range of demographic variables. More information about the survey process can be found here and the ALI data portal can be found here.
What is the relationship between accountability and leadership?
Accountability is a buzzword of modern leadership and governance. Its use has increased exponentially since the 1980s and scarcely a day goes by when there isn’t some mention in the news media of accountability or, more precisely, the lack of accountability in our institutions, especially political, business and civil society institutions.
What role do public perceptions of accountability play in public perceptions of leadership for the greater good in the government, public, private and not-for-profit sectors?
ALI research reveals that public perceptions of accountability is a moderate predictor, or driver, of perceptions of leadership for the greater good in the government, public, private and not-for-profit sectors. This means that the more institutional leaders are perceived by the public as accountable, the more they are perceived to show leadership for the greater good.
In the context of enduring public concern about political and business ethics and persistently low trust in government and business, improving public perceptions of accountability is one way in which institutional leaders can restore public trust in these institutions and their leadership.
Accountability at the sector-level
Having established the relationship between accountability and leadership for the greater good, it’s pertinent to consider what ALI reveals about public perceptions and expectations of accountability in the government, public, private and not-for-profit sectors.
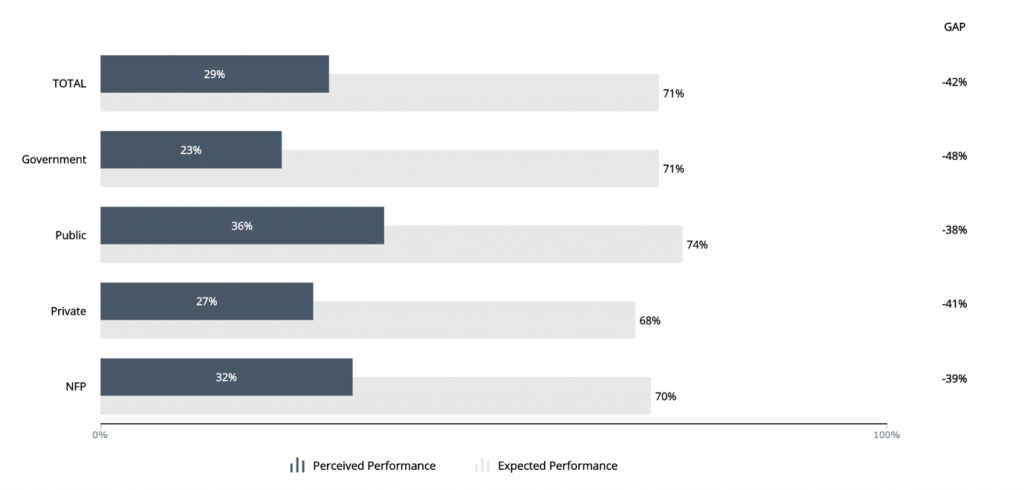
The public have high expectations of the degree to which institutions in the government, public, private and not-for-profit sectors should be accountable. Roughly two-thirds of respondents expect the government, public, private and not-for-profit sector institutions to be accountable to a “fairly large” or “extremely large” extent.
The public sector is regarded as the strongest performer in terms of accountability, with 36% of respondents judging the public sector as accountable to a “fairly large” or “extremely large” extent. Consistent with this, the public sector is also associated with the smallest gap between public perceptions and expectations of accountability (38-percentage points).
The not-for-profit sector is a close second, with 32% of respondents judging this sector as accountable to a “fairly large” or “extremely large” extent. The not-for-profit sector is associated with the second smallest gap between perceptions and expectations (39-percentage points).
The government sector is seen the weakest performer on this criterion, with only 23% of respondents regarding government as accountable to a “fairly large” or “extremely large” extent. Consistent with this, the government sector is associated with the largest gap between perceptions and expectations (48-percentage points).
The private sector is perceived similarly to the government sector, with 27% of respondents regarding this sector as accountable to a “fairly large” or “extremely large” extent. The private sector is associated with the second largest gap between perceptions and expectations (41-percentage points).

Figure 1. Perceived and expected accountability, sector-level, September 2018-March 2020
Explore this data for yourself via the ALI custom chart builder.
Accountability at the institutional-level
Notable differences are found across institutions in terms of perceptions and expectations of accountability.
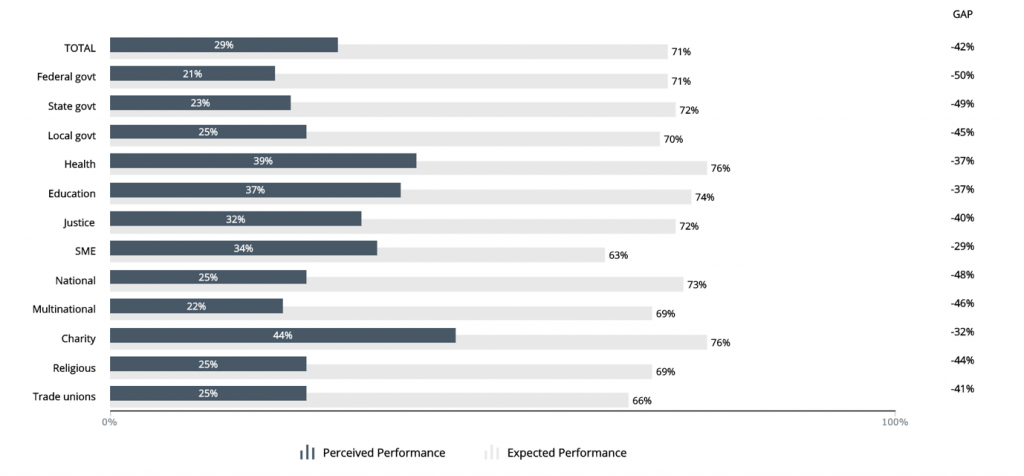
Charities are regarded as the strongest performer in terms of accountability, with 44% of respondents judging charities as accountable to a “fairly large” or “extremely large” extent. Consistent with this, charities are also associated with the smallest gap between public perceptions and expectations of accountability (32-percentage points).
However, perceptions of charities differ markedly from the two other institutions that comprise the ALI measure of the not-for-profit sector; namely, trade unions and religious institutions. Both trade unions and religious institutions are perceived by only 25% of respondents as accountable to a “fairly large” or “extremely large” extent.
Although charities are associated with the most favourable public perceptions of accountability, public health and public education institutions are also well-regarded, with 39% and 37% of respondents, respectively, viewing these institutions as accountable to a “fairly large” or “extremely large” extent.
A similar pattern is observed for the institutions of the private sector. National businesses and multinational corporations are viewed by 25% and 22% of respondents, respectively, as accountable to a “fairly large” or “extremely large” extent. Consistent with this, the institutions are associated with some of the largest gaps between perceptions and expectations. By contrast, the public expects considerably less from small and medium enterprises (SMEs) than other types of businesses. As a result, the public evaluates SMEs more favourably, which produces the smallest perception-expectation gap of all institutions measured by the ALI.
The institutions of the government sector are perceived as among the worst performers in terms of accountability. The Federal Government is perceived as the least accountable institution of all twelve institutions measured by ALI. Specifically, only 21% of respondents view the Federal Government as accountable to a “fairly large” or “extremely large” extent. Consistent with this, the Federal Government is associated with the largest gap between perceptions and expectations (50-percentage points).
State Governments do not fare much better. Only 23% of respondents view State Governments as accountable to a “fairly large” or “extremely large” extent, which, when combined with high expectations of State Government, produces the second largest gap between perceptions and expectations (49-percentage points). Local Governments are perceived as somewhat better than Federal and State Governments – 25% of respondents view Local Governments as accountable to a “fairly large” or “extremely large” extent.

Figure 2. Perceived and expected accountability, institution-level, September 2018-March 2020
Explore this data for yourself via the ALI custom chart builder.
Full details about public perceptions and expectations of accountability in government, public, private and not-for-profit sector institutions are provided in the ALI 2019 Annual Report, which is available here.


